Trends and change in Scottish Housing
by Ken Gibb
This week the Scottish Government published the new trends summary for annual housing statistics across Scotland. There is always something interesting or surprising to be found here and I thought would briefly identify and comment on a few things that struck me (all figures from the new trends summary).
Level of completions
- In 2016-17, there were 18,539 total completions, the biggest total since 2008-09 but still well below pre-recession levels. Looking at the composition of the total, private completions were down a few hundred at 13,187, housing associations built 2,748 units (428 units greater than 2015-16) and councils built 1,143, much the same as the previous year. However, rehabilitation and conversions accounted for more than 1450 units
- Within specific council area patterns vary significantly. In our largest cities, for instance, 76% of new supply in Edinburgh is private sector but only 32% is in Glasgow (fully 42% was housing association development).
- Long term trends suggest private housebuilding, while on an upward trajectory, is still well below the average over the last 20 years.
- The first diagram show very long trends back to 1920 for the share of housebuilding completions between private and social sectors.

Level of affordable supply programme completions and its composition
- Scotland is spending more than £3 billion of public funds in order to build 50,000 affordable units in the current Parliament, 35,000 of which are to be social. In the first year of this programme, 7,336 units were completed, below the averaged target of 10,000 but 13% up on the year before. Just under 2/3 of these were new build and the rest were either rehabilitations or off the shelf purchases.
Tenure shares and tenure change
- Tenure change in Scotland continues to be noteworthy. The bulletin points out that in 1981, 40% of the Scottish dwelling stock was owner-occupied, rising to a peak of 63% but then fell back over the last 6 years to just 58% in 2015. Alongside this has been the remarkable growth of the private rented sector, trebling as a share of all units since 1999 and increasing from 10% to 15% between 2008 and 2015.
- The second chart shows the movement on absolute numbers of the three main renting tenures between 2001 and 2015. The PRS is now comfortably the largest of the three.
- Locally, home ownership varies from 83% in East Renfrewshire (2015) to 44% in Glasgow (2015). Private renting (also in 2015) varies from 4% in East Renfrewshire to 27% in Edinburgh. For social housing shares, and always the outlier, East Renfrewshire has 12% of its stock in social renting tenures compared to 37% in West Dunbartonshire.

Local authority evictions
- The data indicates that for 2016-17, there were 1,421 evictions or abandonments associated with council tenancies. This equates to 15% of court actions initiated, 5% of all proceedings issued and 0.5% of all lettable stock.
Trend in LA lettings
- A long term decline in local authority lettings has stabilised. In 2016-17, there were 25,788 lettings, slightly down form the previous year, and 40% of lettings were to homeless households as against 38% the year before. At the beginning of the previous decade, there were more than 50,000 lettings a year, though much of the reduction is due to stock transfer in general and Glasgow’s transfer, in particular.
- Only an incomplete proxy for social need or demand, local authority housing lists (and common registers) were standing at, as of 31 March 2017, just over 162,000 households, a 3% decrease on the previous year and the 9th successive annual decrease.
The arc of the RTB in Scotland
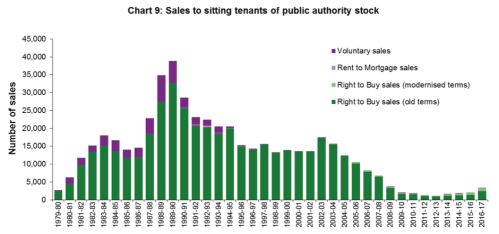
- Just under half a million public sector (and stock transfer) homes were sold under the council house sales right to buy scheme, now ended in Scotland. The third chart shows the rise and fall of annual sales.
- In 2016-17, RTB sales totalled 3,510, up 38% from the previous year. Locally sales were highest in absolute terms in Fife, North Lanarkshire, South Lanarkshire and Glasgow.
Lots to think about in this data but it would be nice to join this up with private market data (via the Centre for Housing Market Analysis) and housing association data from the Scottish Housing Regulator, Maybe one day? I am working with colleagues at the Urban Big Data Centre at the University of Glasgow on monitoring the private rented sector through letting and adverts data – that might help to further close the data loop.
